Performance modeling
Driven by higher energy costs, owner desires for increased sustainability and a changing regulatory environment, building energy performance requirements are getting ever more stringent.
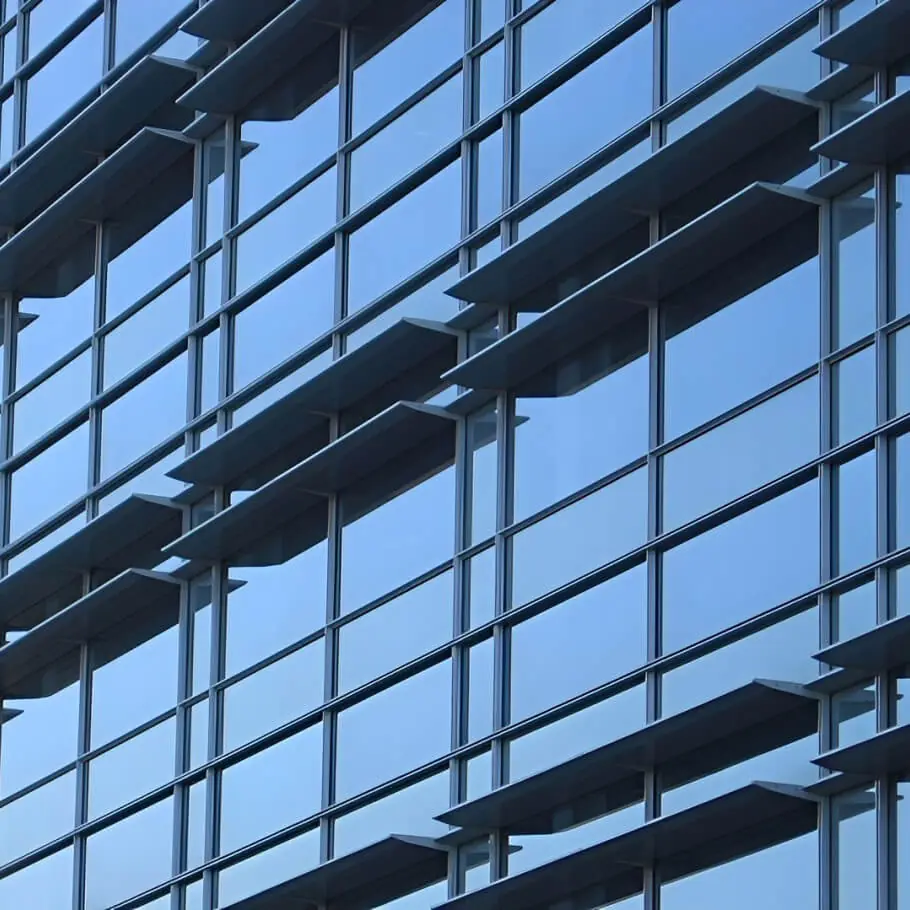
The facade clearly plays a vital role in overall building energy performance.
Optimizing the balance of enclosure aesthetic & performance needs an understanding of the building energy impacts of design choices. Enclosure performance modeling can be key to that understanding.
We have been working exclusively on facades for many years so we know when to use analysis & when to simply use experience to advise the team.
Our modeling approach augments our analytical horsepower with visualization techniques & experience-based advice so architects & owners can visually compare various options to easily make informed facade design choices.
We have built models to assess:
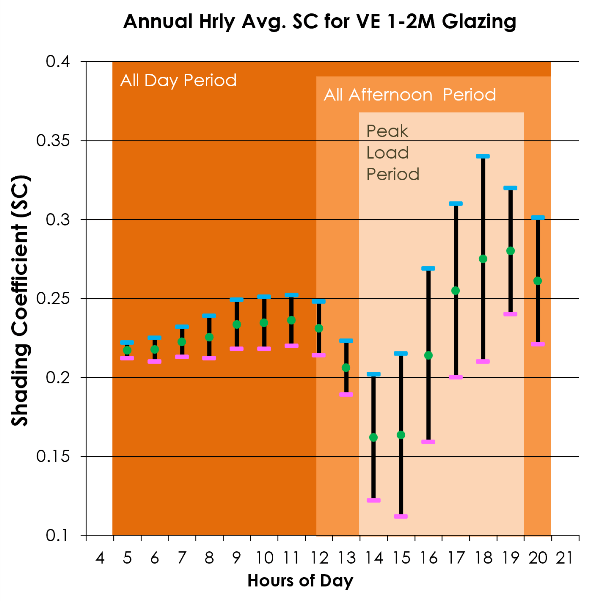
- The impacts of shading & facade configurations on total building energy use,
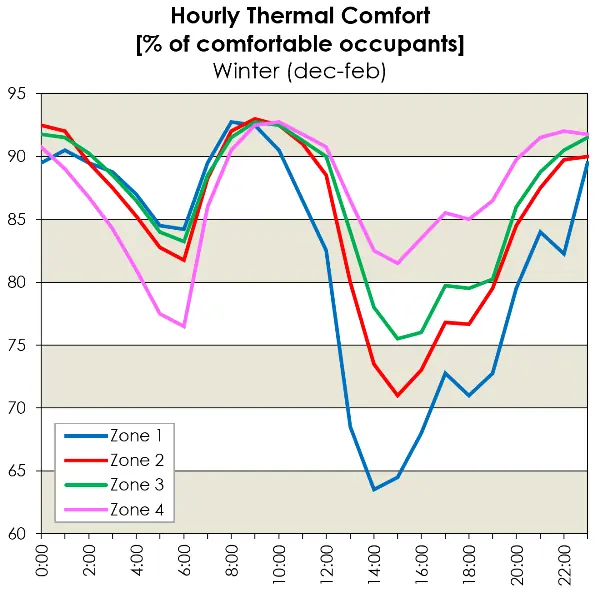
- The effect of design options on occupant comfort,
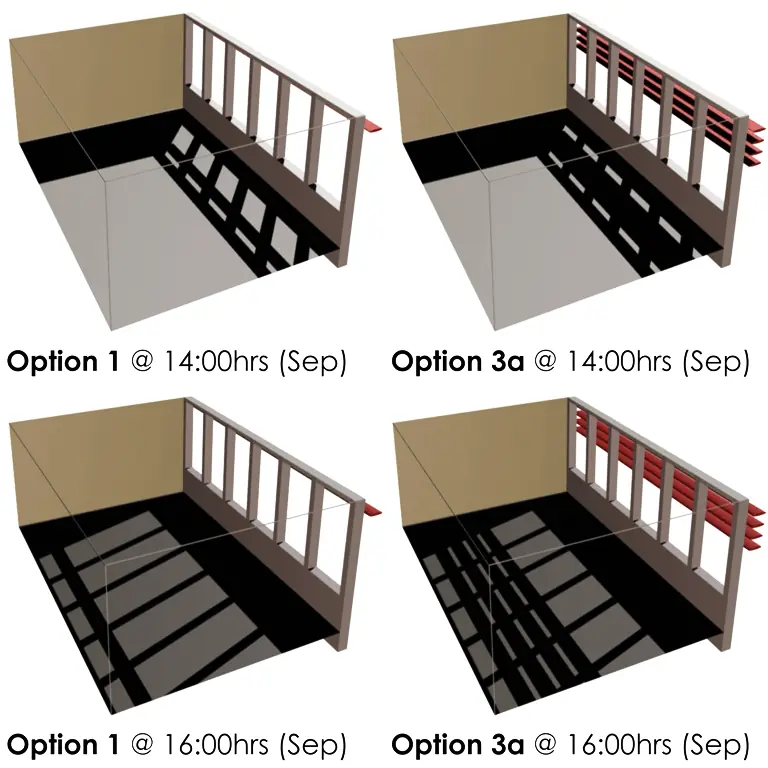
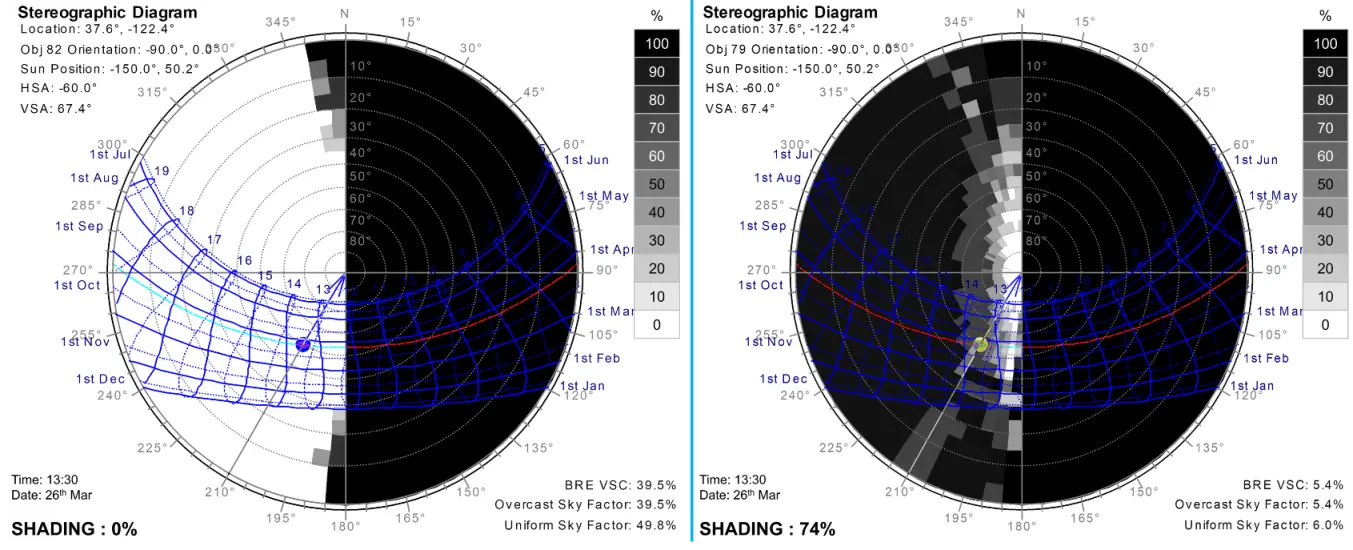
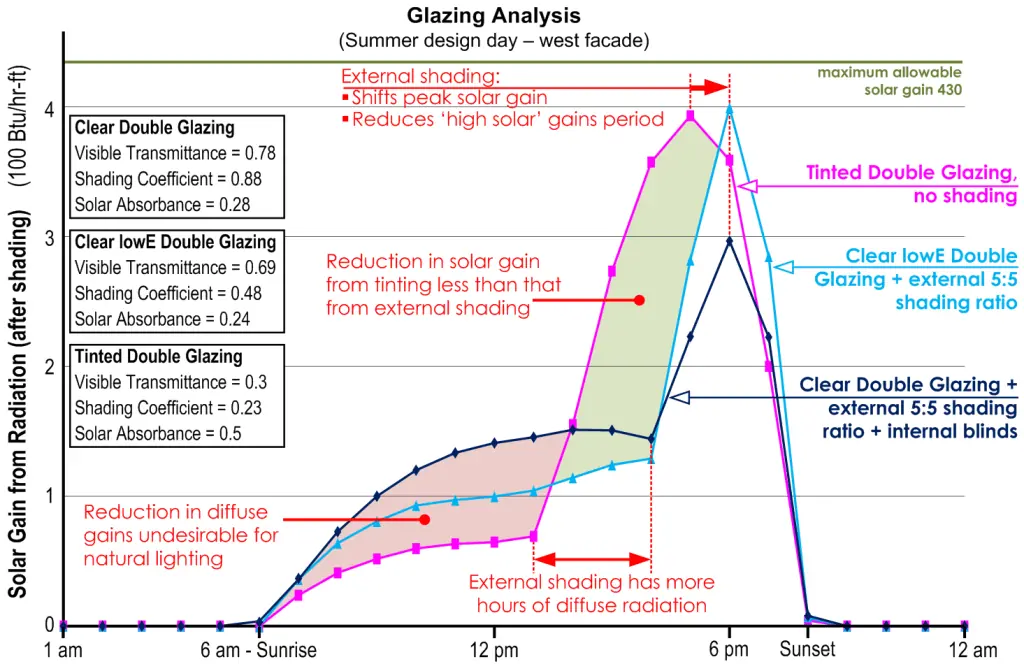
- Shading alternatives that achieve the desired sun penetration & solar-thermal control,
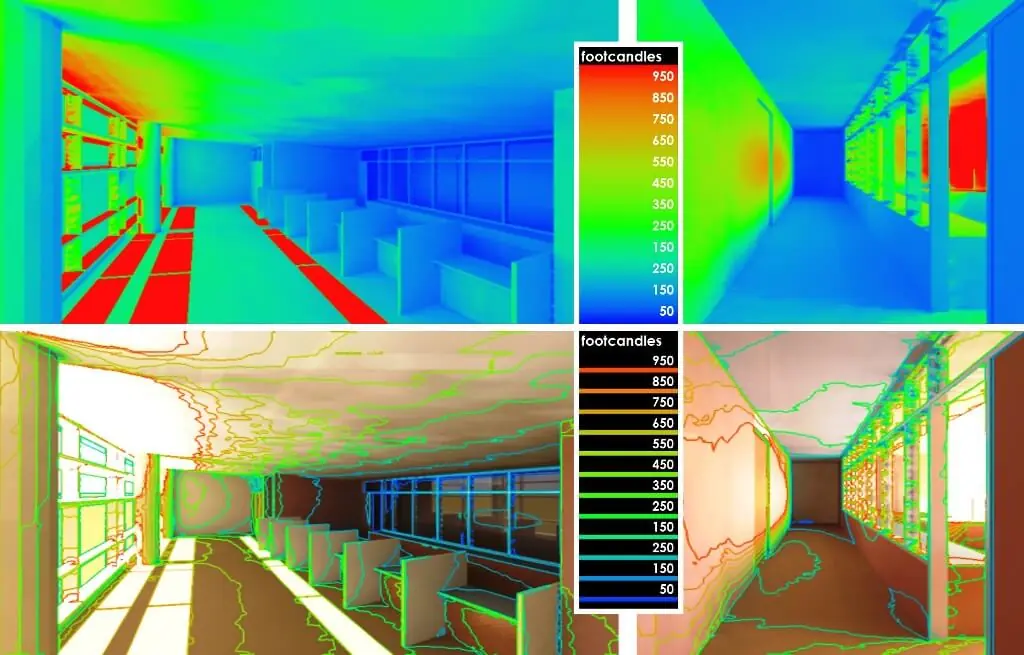
- Configurations & components to balance daylight penetration & glare control, particularly for glare-sensitive classrooms, libraries & museums,
- Condensation risk,
- Ventilation & control efficacy for double-skin facades, including air movement velocity for acoustic impacts.
Typical scope of work includes assessment of:
- Solar thermal penetration
- Facade solar heat absorption & reradiation
- Daylight penetration & glare control
- Occupant thermal comfort
- Condensation risk
- Energy use & cost